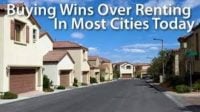
Is Renting Really Cheaper Than Owning a Home?
04 May 2017 | MPA Mortgage Professional America | www.mpamag.com
 The responsibility of owning a home can be intimidating for people who’ve only rented in the past, but new data from Zillow suggests renting can actually cost more.
Zillow’s analysis found out that sans increasing monthly housing costs, a typical renter can buy a home almost 50% more expensive than the median valued home and still get to keep the same amount of monthly housing budget.
The median US home value is $196,500, while the median rent in the country is $1,416 per month – an amount enough to pay for monthly housing expenses needed to own a $289,505 home.
“The decision between buying and renting is a financial trade-off between saving more each month on a mortgage payment versus spending more on rent but taking advantage of the location and lifestyle amenities urban renting often offers,” said Zillow Chief Economist Dr. Svenja Gudell. “Recent slowdowns in rent growth may take some of the edge off for renters saving to become homeowners. This is good news, since saving a down payment, qualifying for a loan and finding a home available at a manageable price remain hurdles for millions of aspiring buyers.”
Renters in Cleveland can afford a $174,194 home while retaining monthly housing costs, which is representative of more than 80% of homes on the market now, according to Zillow.
On the other hand, San Francisco is one of the only cities where monthly rental payment does not cost more than owning a median valued home.
Here are 15 cities and their rent-versus-owning ratio from Zillow:
|
City
|
Zillow Rent
Index (ZRI), March 2017 |
Zillow Home
Value Index (ZHVI), March 2017 |
Value of Home
Affordable without Increasing Monthly Housing Costs |
Share of
Available Inventory |
|
United States
|
$1,416
|
$196,500
|
$289,505
|
56.8%
|
|
New York, NY
|
$2,372
|
$650,000
|
$484,962
|
28.7%
|
|
Los Angeles, CA
|
$2,863
|
$622,900
|
$585,348
|
27.6%
|
|
Chicago, IL
|
$1,650
|
$220,900
|
$337,347
|
57.1%
|
|
Philadelphia, PA
|
$1,218
|
$136,100
|
$249,023
|
71.9%
|
|
Phoenix, AZ
|
$1,256
|
$208,600
|
$256,793
|
40.6%
|
|
Las Vegas, NV
|
$1,245
|
$212,500
|
$254,544
|
47.5%
|
|
San Diego, CA
|
$2,503
|
$558,600
|
$511,745
|
31.3%
|
|
Dallas, TX
|
$1,393
|
$163,200
|
$284,803
|
24.7%
|
|
San Jose, CA
|
$3,310
|
$862,800
|
$676,739
|
28.3%
|
|
Jacksonville, FL
|
$1,171
|
$148,400
|
$239,414
|
59.1%
|
|
San Francisco, CA
|
$4,235
|
$1,167,200
|
$865,857
|
22.8%
|
|
Austin, TX
|
$1,848
|
$316,800
|
$377,829
|
33.2%
|
|
Detroit, MI
|
$751
|
$ 39,100
|
$153,544
|
92.2%
|
|
Columbus, OH
|
$1,150
|
$127,400
|
$235,121
|
71.2%
|
Would you like to know your precise purchase power? Then click here and simply type the words “purchase power” in the body of your message.
David Hughson
Mortgage Planner | Rent Killer
858-863-0264
david@greenmeansgrow.com